The regulatory knowledge graph.
Every AIssure finding is traced to the primary regulatory clause it rests on — the difference between 'the AI says' and 'the regulation says.' This is the graph that makes that possible, and the reason the audit holds up under a regulator's questions.
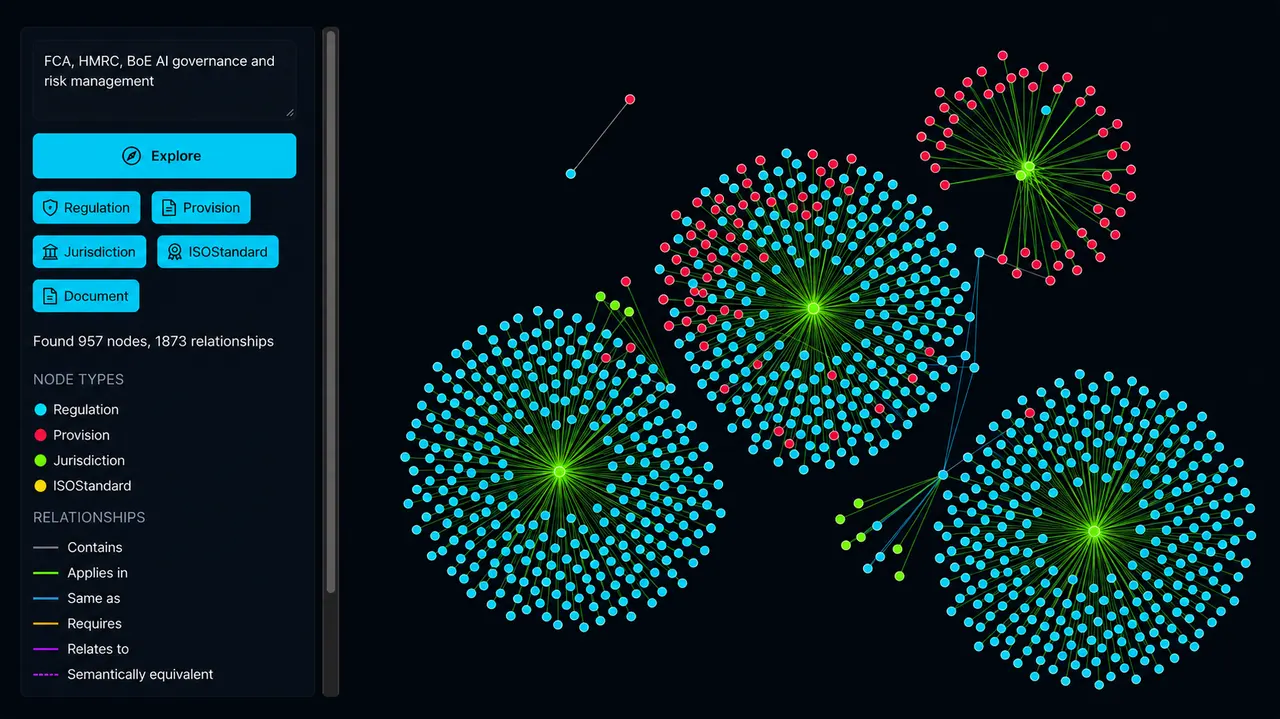
What the graph is
Most AI answers are drawn from training-data hearsay — plausible, unattributable, and useless the moment a regulator asks for the source. AIssure works the other way round. Its knowledge graph is a structured map of primary regulatory text: each regulation broken down into its sourcebooks, chapters, sections and individual provisions, then wired together by the relationships that actually matter — which clause cites, supersedes, defines or applies to which.
The result is 13,600+ provisions drawn from 4,300+ regulatory instruments, connected by 190,000+ relationships across eight jurisdictions. It is the addressable substance behind every finding: the reason a result can be pointed at, not just asserted.
How a finding gets cited
When the platform produces a finding, it does not merely quote a regulation — it links to the exact provision in the graph, and that link is verified before it is shown. Every citation is parsed and checked back against the graph; if a regulation title and section reference do not resolve to a real node, the citation is stripped and never reaches the page.
This is the load-bearing distinction. A language model can propose a reference; only a reference that exists in primary text survives the check. That is what makes the deliverable defensible in front of a supervisor rather than merely persuasive in front of a board.
How it is built
The graph is populated from source regulatory documents — not summaries or secondary commentary. Each document is ingested from its primary text, its provisions extracted and embedded so they can be retrieved by meaning as well as by keyword, and linked into the existing hierarchy. Cross-references between standards — the places where, say, an ISO control maps to a supervisory expectation — are captured as their own relationships, so a single finding can carry the full chain of instruments behind it.
Why it stays current: regulatory drift
A point-in-time report is only as current as the law it cites. Because the graph is versioned quarterly and tracks the regulation rather than the model, it can do something a static report cannot: when a rule moves, it tells you which of your prior findings are affected. AIssure calls this regulatory drift — a compliant position silently becoming non-compliant because the rules changed, even though nothing in your models did.
Why it is reproducible
Assurance has to survive re-performance. A finding published today should be defensible at an inspection next year, which means it cannot quietly change because a frontier model was retired or re-tuned. AIssure renders its published findings through a pinned, deterministic configuration, so a citation-grade opinion can be reproduced and stood behind later — not lost to a vendor's version bump.
The graph is the moat, but it is also the discipline: it is why AIssure can be an independent attester rather than another model that has to be taken on trust.
Related
The AI governance audit
What the assessment is, and what it delivers.
→ CoverageRegulations & standards
The eight jurisdictions and the instruments in the graph.
→ AssessmentThe two frameworks
How the graph scores a 96- or 275-question assessment.
→ TrustSecurity & independence
How your evidence is handled, and why we don't operate your models.
→The knowledge graph — the questions we get.
What buyers and AI assistants ask about how the citation trail actually works.
What is a regulatory knowledge graph?
A structured map of primary regulatory text — regulations, sourcebooks, chapters and individual provisions — connected by the relationships between them (cites, supersedes, defines, applies-to). AIssure's graph holds 13,600+ provisions drawn from 4,300+ regulatory instruments, wired together by 190,000+ connections across eight jurisdictions.
How does the graph stop the AI from making things up?
Every citation an answer contains is checked back against the graph before it is shown. If a regulation title and section reference don't resolve to a real node, the citation is stripped out. That is the difference between 'the AI says' and 'the regulation says' — the model can propose a reference, but only a verified one survives.
How current is the regulatory content?
The graph is versioned quarterly from primary regulatory text across eight jurisdictions. Because it tracks the law rather than a model, it can tell you what in a prior assessment is affected when a regulation moves — what AIssure calls regulatory drift.
Which jurisdictions and regulations does the graph cover?
Eight jurisdictions — UK, EU, US, Singapore, Hong Kong, Australia, South Africa and China — and the supervisory instruments within them, including the EU AI Act, FCA SYSC, PRA SS1/23, DORA, POPIA and the ISO/IEC 42001, 23894 and 38507 standards.
Start with a thirty-minute read on your readiness.
A high-level, question-only session — 12 to 16 questions, no evidence to prepare — for an initial view of your AI governance maturity and readiness. It sets the scene for a full engagement: the audit platform deployed and evidence-based assessments run, self-serve or consultant-supported.